
A project by John TibellHuggtabellWhen will they bite? On your water, today.
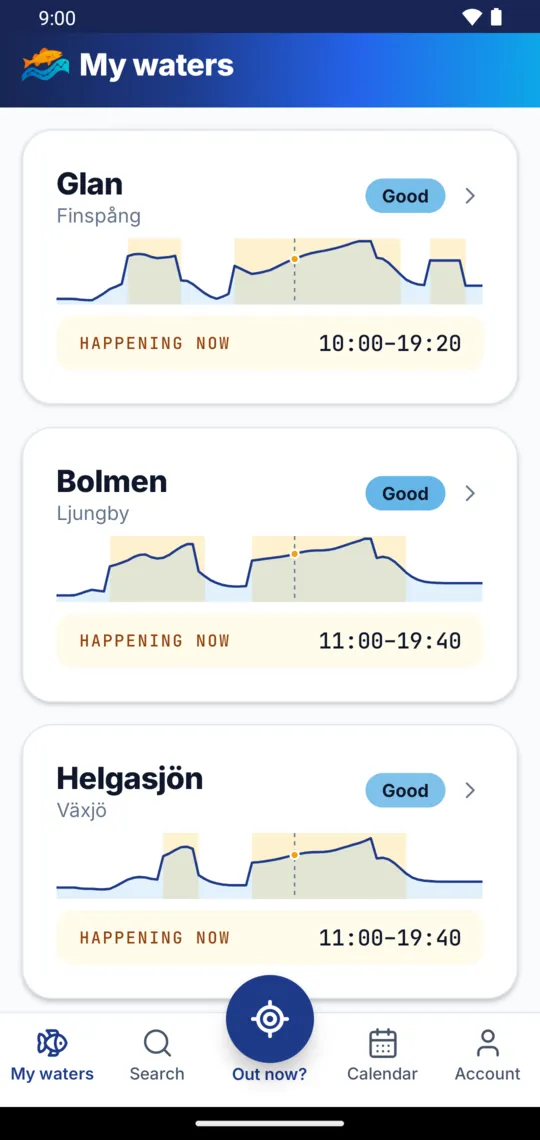
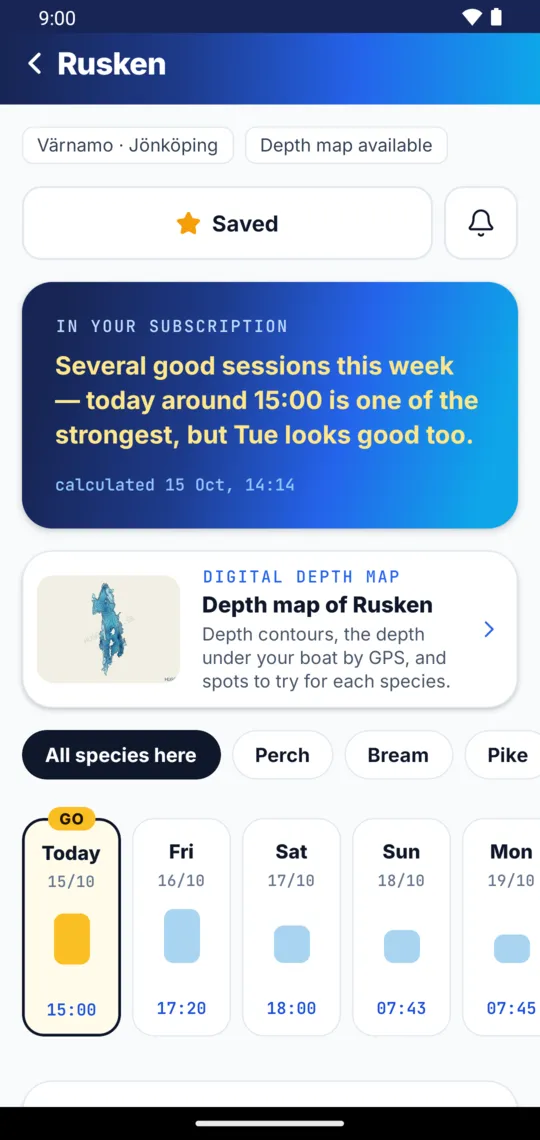
A bite table for every lake, stream and coast in Sweden. Every water gets its own curve, hour by hour, with the day's weather in it, and the curve is redrawn when the weather turns. Free, no sign-in.

A bite table, not a solunar table
The moon keeps different hours in Ystad and in Kiruna, almost two hours apart. A printed table doesn't know that.
A printed bite table
- The same times in Ystad as in Kiruna
- Only sun and moon. The weather isn't in it at all
- Printed once, and the same poster year after year
A curve for your water
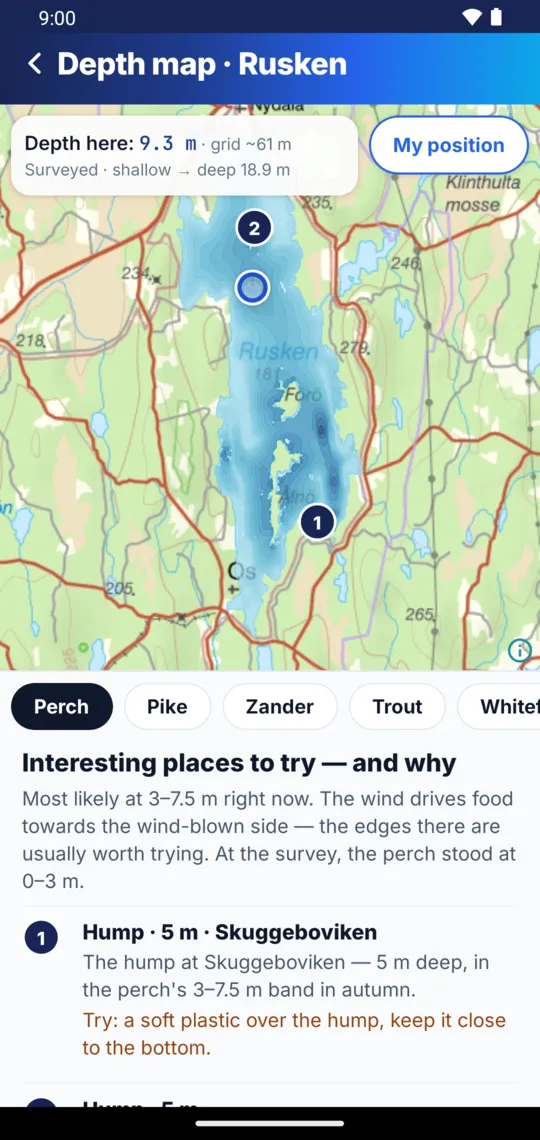
- Every lake, stream and coast in Sweden, each with its own curve
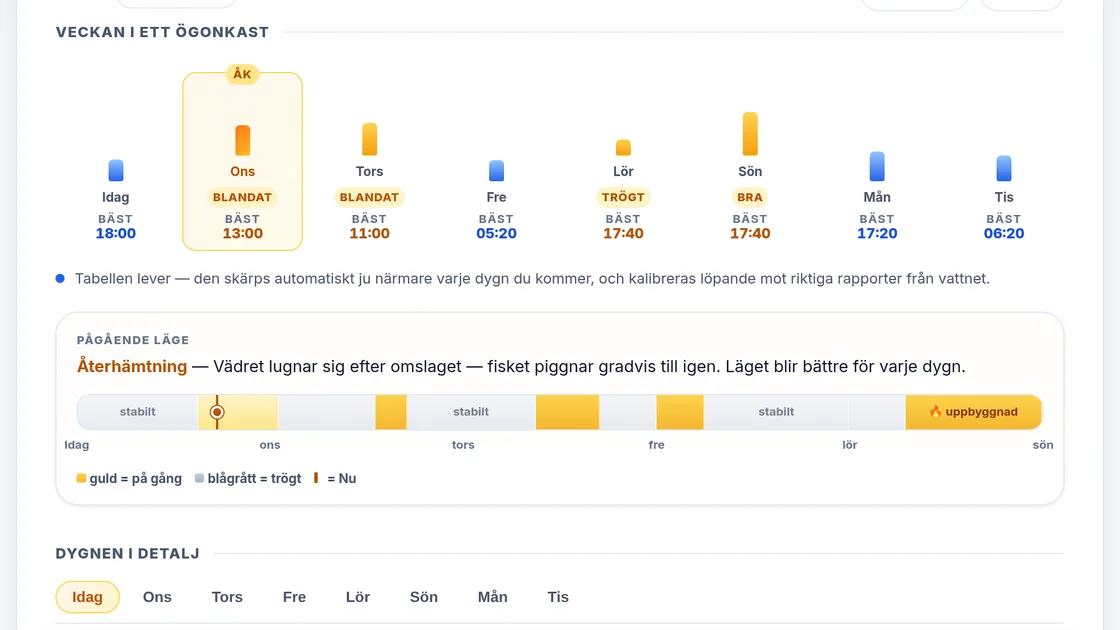
- Today's weather in it: cloud, wind, rain, air pressure and water temperature
- Redrawn every day, and again when the weather turns
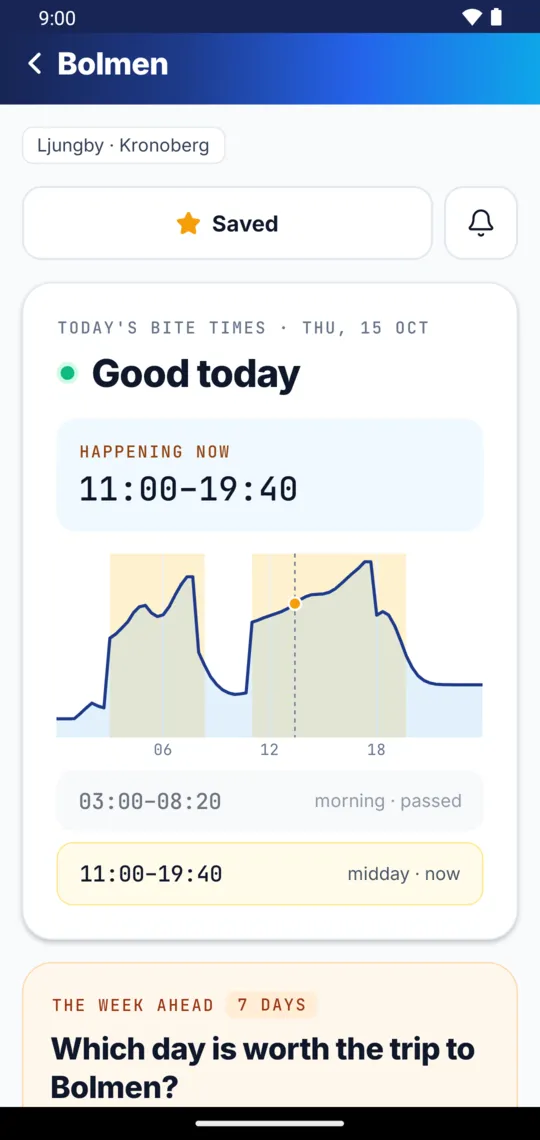
One curve, four things to look for
Point at a number to find it on the curve.
1
2
3
4
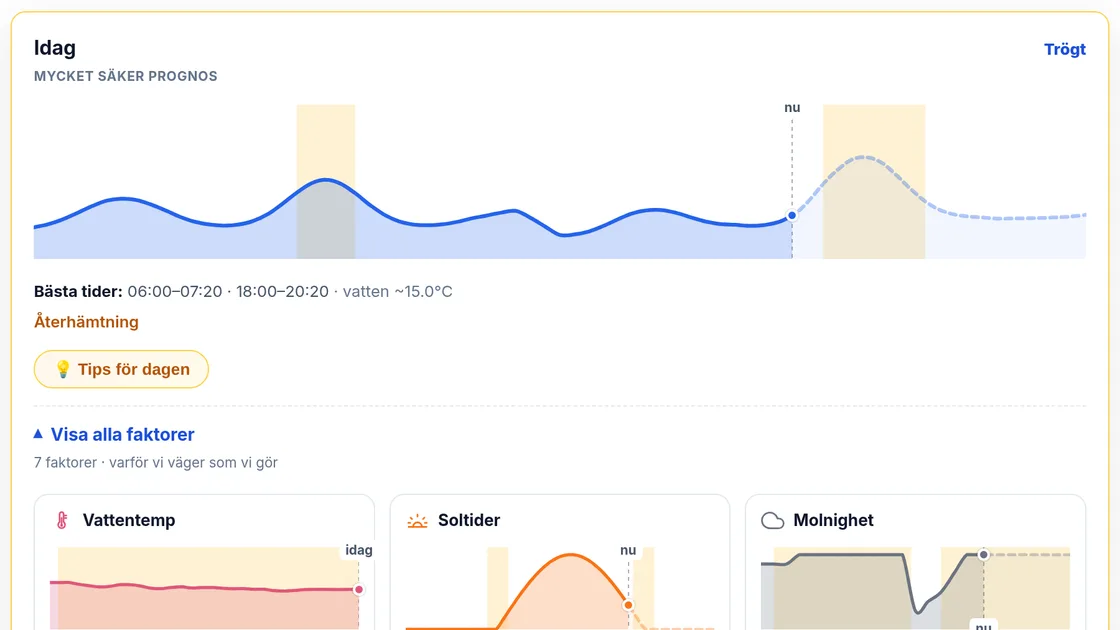
- 1The gold windows
The day's best times. In this example: 06:00–07:20 and 18:00–20:20.
- 2Now
A line marks the present. The rest of the day is the forecast, drawn dashed.
- 3The verdict
One word for the day, from slow to good, so you can decide at a glance.
- 4Why
Under the curve, each factor gets its own small chart: water temperature, daylight, cloud and more. You can see what's pushing the day up or down.
Month by month, species by species
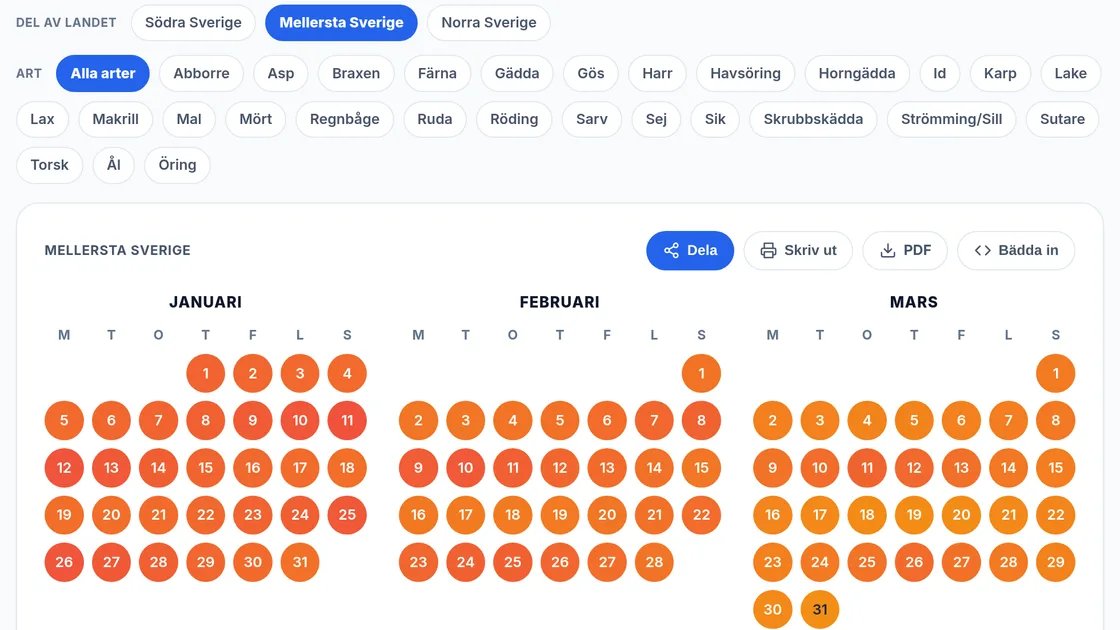
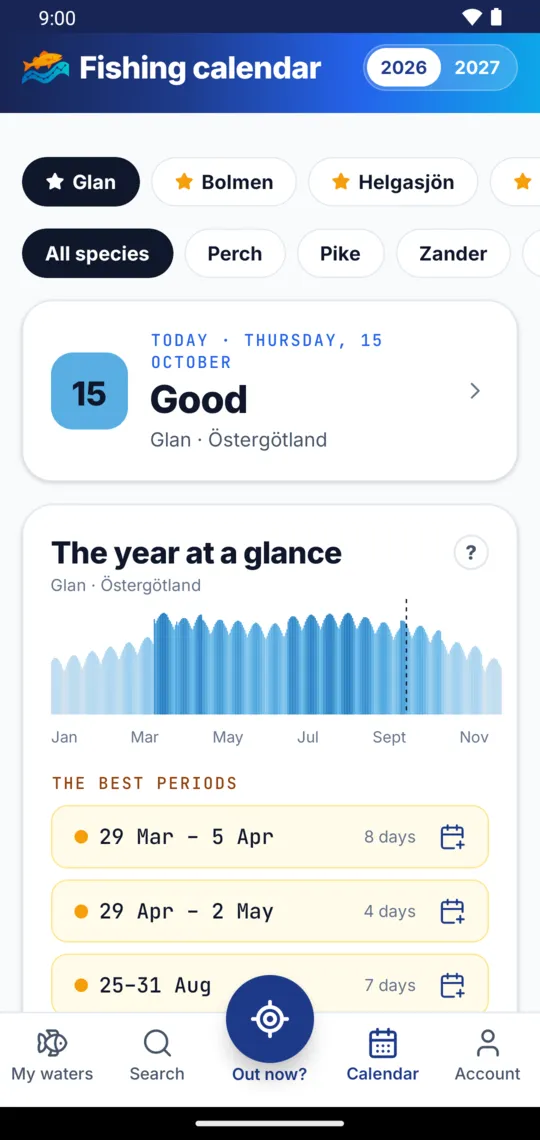
The year's bite table for the south, middle or north of Sweden, for all species or just the one you're after, from perch and pike to salmon and char. Or your own water's season, day by day.

“Finally, a real bite table.”
Most bite tables online are really solunar tables with a new label: the same moon curve for the whole country, whatever the water, whatever the weather. Swedish anglers deserve better than that.